Data Center Construction Estimating: Cost per MW in 2027
A data center costs roughly $11 million to $18 million per megawatt to build before servers, depending on what scope you are pricing. The most quoted 2026 benchmarks put shell and core at about $11.3 million per megawatt (JLL, 2026 Global Data Center Outlook), construction only at about $12.1 million per megawatt for a US average (Turner & Townsend, Data Centre Construction Cost Index 2026-27), and an all-in greenfield build at about $17.6 million per megawatt (Cushman & Wakefield, 2026 Data Center Development Cost Guide). Add AI fit-out and the number climbs toward $25 million per megawatt, and a fully equipped AI campus with GPUs runs about $35 million to $60 million per megawatt. If you are bidding one in 2027, start from the megawatts, pin down the scope line, and only then touch the square footage.
Who this is for: general contractors, MEP estimators and owners pricing data center work in 2027, whether the job is a single enterprise hall, a colocation build or a hyperscale phase.
Why a data center is priced per megawatt, not per square foot
A data center is not a warehouse with servers in it. The electrical and mechanical systems that scale with megawatts are most of the budget, and two buildings with the same footprint can cost twice as much as each other if one carries twice the IT load. Square footage is a check you run at the end, never the driver you start with. Every per-megawatt figure in this guide carries its scope line, because a $12 million per megawatt number and a $17.6 million per megawatt number can both be right for the same market when their scopes differ. Before you quote any figure, answer five questions: shell only or all-in greenfield, construction only or including land, with or without utility-side work, with or without tenant fit-out, and with or without servers and GPUs. A benchmark quoted without those answers has not estimated anything.
The 2027 benchmarks, with their scope lines attached
No 2027 edition of these indexes had been published at the time of writing, so the figures below are the latest published benchmarks, all from 2026 sources. Use them as your 2027 starting point and adjust for escalation, market and scope. Do not relabel them as 2027 figures.
| Source | 2026 figure | Scope |
|---|---|---|
| JLL, 2026 Global Data Center Outlook | $11.3M per MW | Shell and core, global average, 50 MW single-tenant air-cooled facility; excludes land and IT equipment; up 6% from $10.7M in 2025, from $7.7M in 2020 |
| Turner & Townsend, Data Centre Construction Cost Index 2026-27 (Oct 22, 2026) | $12.08 per watt (about $12.1M per MW) | Construction only, US average, 30 to 50 MW air-cooled hall; excludes land, utility connections and IT equipment; AI-specific facilities $14 to $16 per watt; Dallas about $9.5M, Silicon Valley about $13.3M per MW |
| Cushman & Wakefield, 2026 Data Center Development Cost Guide | $17.6M per MW | All-in greenfield, most modern US facilities; land, power, shell, MEP and contingency; excludes chips and GPUs; range $8.9M to $23.3M, up 21% since late 2024 |
| Epoch AI (May 2026) | $35M to $60M per MW | Fully equipped AI campus, all-in including GPUs; GPUs alone can exceed the building cost, so never place it beside a construction-only number without saying so |
The spread between the first three rows is a scope story, not a disagreement. JLL prices the building and its core systems, Turner & Townsend prices construction for a defined hall, and Cushman & Wakefield prices the whole greenfield project. Pick the row that matches your scope, then adjust for your market: Turner & Townsend alone runs from about $9.5 million per megawatt in Dallas to about $13.3 million per megawatt in Silicon Valley, which is a reminder that a national average is a starting point, not a bid.
Where the money goes
Power infrastructure is the largest single category in a greenfield build. Cushman & Wakefield puts it at about 21% of greenfield cost, covering the substation, switchgear, generators, UPS, distribution and busway. Powered land runs about 7%, or about $584,000 per megawatt in primary US markets, up 51% year on year. Switchgear prices rose about 60% from December 2021 to early 2026, which is why long-lead electrical equipment now sets the schedule as much as the price.
A second, narrower breakdown from PulseRevOps (October 2026) puts power at 35 to 45% and cooling at 20 to 30% of a buildout budget, with design, engineering, permits and project management at 10 to 15%. Those shares use a buildout scope, not a greenfield scope, so keep the two breakdowns separate. Either way, the power chain and the cooling chain are the estimate, and everything else is rounding by comparison.
Tier is the cost lever after megawatts
Uptime Institute tiers decide how much redundancy you buy, and redundancy is the second biggest cost lever after the megawatts themselves. Tier II, with N+1 on some systems and a single distribution path, runs roughly 20 to 30% cheaper than Tier III. Tier III, concurrently maintainable with N+1 on all critical systems and about 99.982% availability (about 1.6 hours of downtime a year), is the enterprise and colocation standard. Tier IV, fault tolerant at 2N or 2N+1 with about 99.995% availability, costs about 25 to 50% more than Tier III, because every system has a mirror, including UPS, generators and cooling paths. That uplift is a range from secondary guides, not a settled number, so carry it as a range and confirm it against the project design.
| Tier | Redundancy | Availability | Illustrative total project cost per MW of IT load |
|---|---|---|---|
| Tier I | Basic capacity, no redundancy | About 99.671% | $4M to $7M |
| Tier II | N+1 on some systems, single path | About 99.741% | $5M to $9M |
| Tier III | N+1 on all critical systems, concurrently maintainable | About 99.982% | $7M to $12M |
| Tier IV | 2N or 2N+1, fault tolerant | About 99.995% | $10M to $15M+ |
That table is an illustrative range from a secondary guide, not a Turner & Townsend or Cushman & Wakefield figure. Its job is to show a client why a Tier IV requirement moves the budget, not to replace a priced takeoff. Never apply a Tier IV figure to a Tier II build, and never price a tier you have not confirmed in writing from the owner.
Cooling follows rack density, and density follows the workload
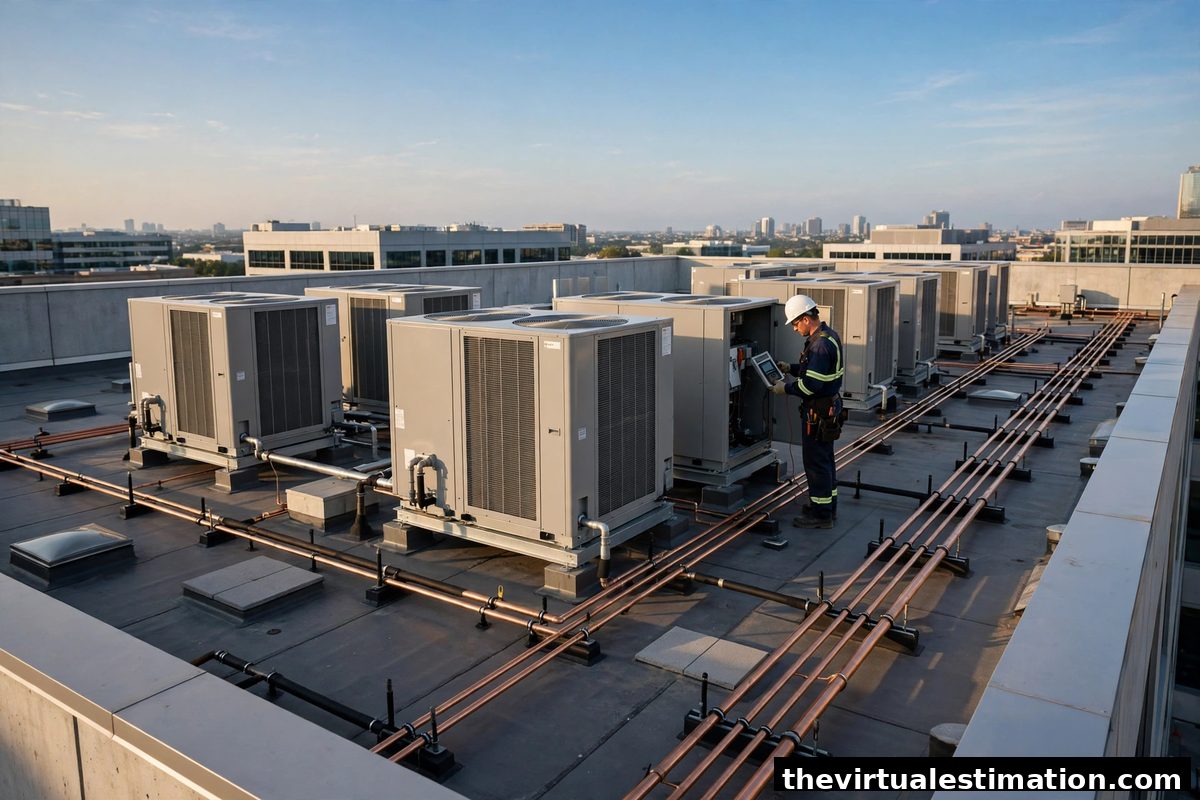
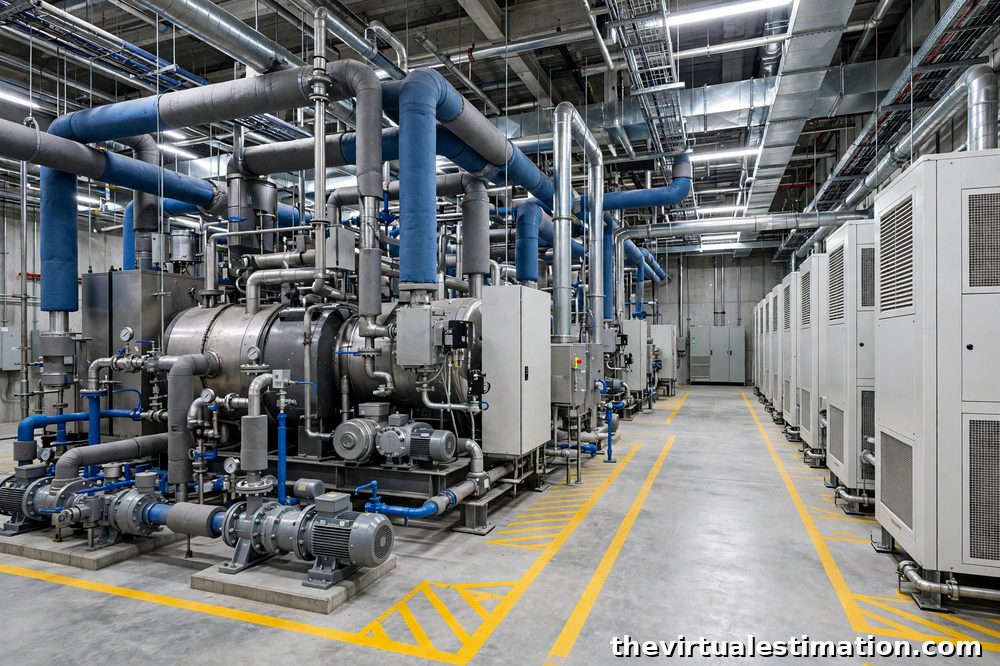
Rack density decides the cooling system, and the cooling system decides a large part of the cost. Air cooling, with CRAC and CRAH units, chillers and containment, fits lower-density halls. Direct-to-chip liquid cooling fits racks at 30 to 50 kilowatts and above, which is where AI and high-performance computing halls live. Turner & Townsend puts the construction premium for liquid-cooled capacity at 7 to 10%, and a fully fitted direct-to-chip liquid facility delivers at about $17 million to $25 million per megawatt, according to a secondary source (Global Data Center Hub, September 2026). AI-optimized centers run 50 to 100% more per square foot than traditional centers.
Per-square-foot figures are sanity checks only, from secondary sources, and they belong at the end of your estimate, not the front: enterprise and Tier II at about $600 to $750, colocation and Tier III at about $750 to $950, hyperscale and Tier IV at about $950 to $1,100 or more, and AI-optimized at about $1,100 to $1,500 or more per square foot. If your per-megawatt number and your per-square-foot check disagree by a wide margin, one of them is using the wrong scope, and it is usually the per-square-foot one. The HVAC estimating guide covers ductwork, equipment, controls and commissioning in the detail this section skips.
Facility type changes the estimate, not just the label
Five facility types dominate the market, and each one changes what you price. An enterprise center is a single tenant running its own load. A colocation center sells white space by the megawatt or kilowatt to many tenants, so the fit-out is phased by tenant and the shell is built ahead of demand. A hyperscale center runs 30 to 50 megawatts or more in phased halls, so the estimate is really a series of hall estimates with shared infrastructure. An edge center is small and distributed, with lower redundancy, so a hyperscale figure applied to it will overstate the cost. An AI and high-performance computing center runs high-density racks with liquid cooling and heavier power distribution, so a standard figure will understate it. Say which type each benchmark assumes before you use it.
The power chain is where the estimate is won or lost
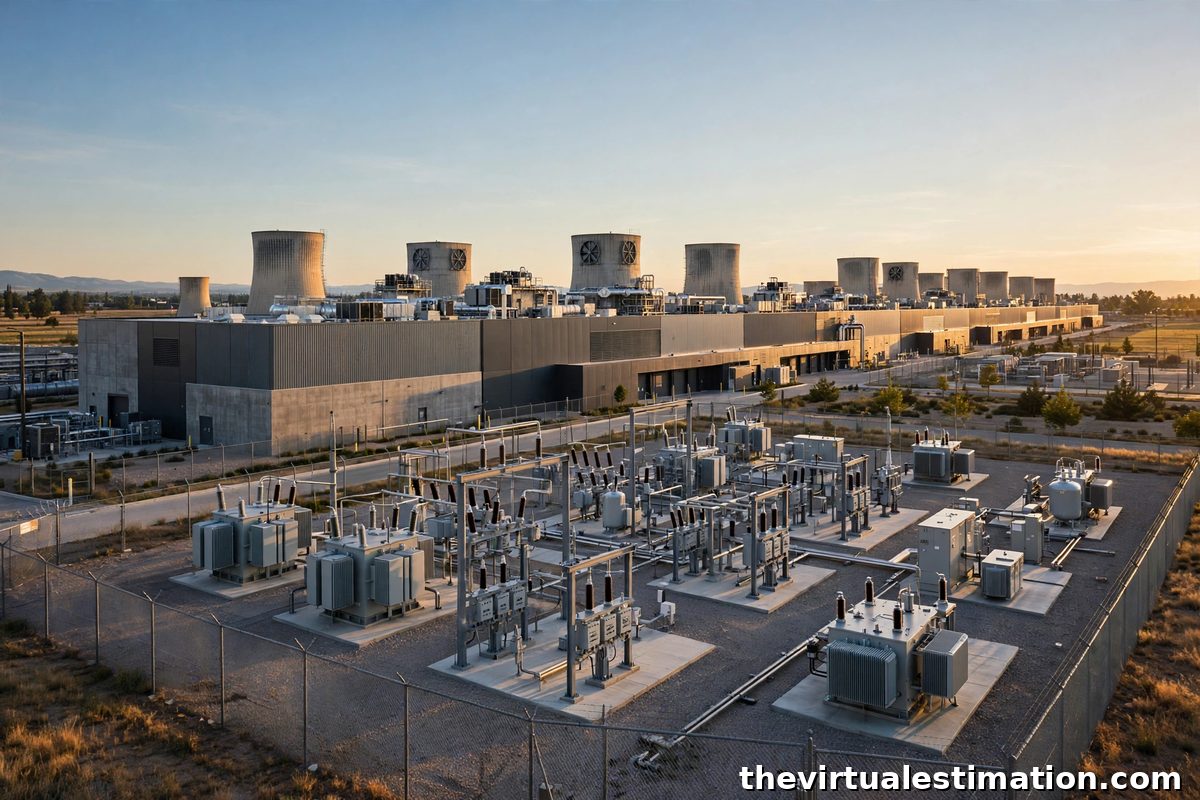
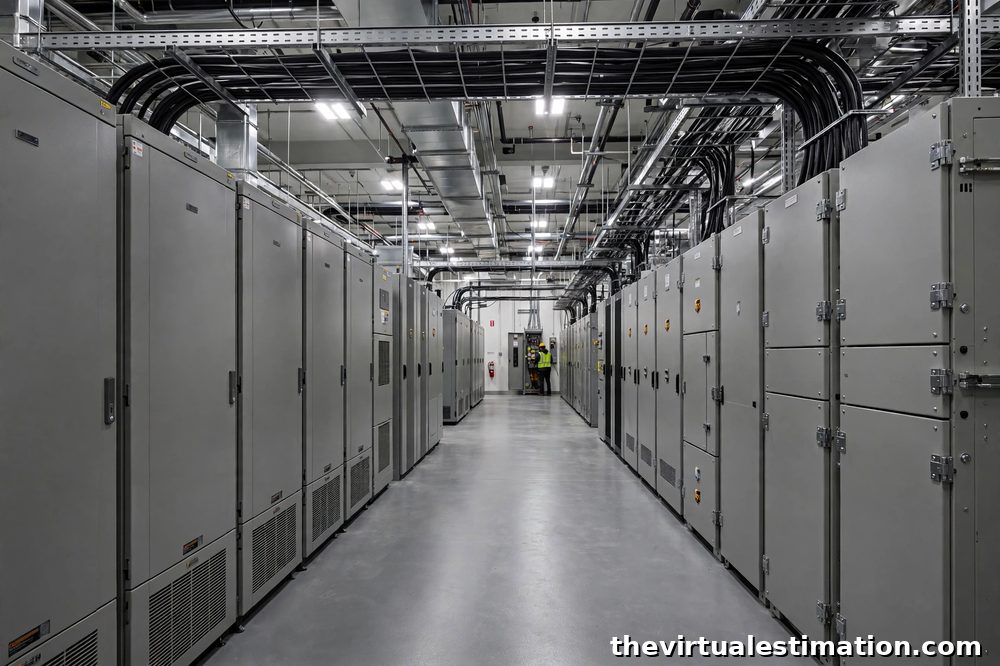
Start from IT load, not from the building: critical IT megawatts, rack count and kilowatts per rack, redundancy topology (N, N+1 or 2N), and the split between white space, support space and shell. Then price by system, in the order the power flows: utility interconnection and substation first, then medium-voltage switchgear and distribution, generators and fuel, UPS and batteries, busway and PDUs, and the cooling chain of chillers, towers, pumps, CRAH and CRAC units, and coolant distribution units for liquid cooling. The electrical estimating guide walks through conduit, wire, panels and devices in the detail the power chain needs.
Each system gets its own quantity, unit and lead time, because long-lead electrical equipment sets the schedule as much as the price. Switchgear, transformers, generators and UPS units carry lead times that can stretch a program by months, and a takeoff that prices them without their lead times has only done half the job.
The takeoff, system by system
| System | Quantity basis | Unit | Lead time |
|---|---|---|---|
| IT load and redundancy | Critical IT MW, rack count, kW per rack, N / N+1 / 2N topology | MW, racks | Design decision, before pricing |
| Utility interconnection and substation | Service size, transformer bays, switchyard scope | Each, MVA | Longest lead on the project |
| Medium-voltage switchgear and distribution | Switchgear lineups, feeders, breakers | Each, LF | Long lead |
| Generators and fuel | Generator sets, fuel storage, day tanks | Each, kW, gallons | Long lead |
| UPS and batteries | UPS modules, battery strings, runtime minutes | Each, kW, minutes | Long lead |
| Busway and PDUs | Busway runs, tap boxes, PDU count | LF, each | Moderate |
| Cooling chain | Chillers, towers, pumps, CRAH/CRAC units, coolant distribution | Each, tons | Moderate to long |
| Shell and structure | Floor area, wall area, roof, structural frame | SF | Standard |
| Raised floor and containment | White-space area, containment aisles | SF, LF | Standard |
| Fire suppression and alarm | Clean-agent or pre-action zones, detectors, panels | Each, SF | Standard |
| Security and access | Readers, cameras, mantraps, fencing | Each | Standard |
| Low voltage, cabling and fiber | Cable runs, fiber strands, pathways | LF, strands | Standard |
| Commissioning | Levels 1 to 5, integrated systems test | Lump sum by phase | At handover, priced as scope |
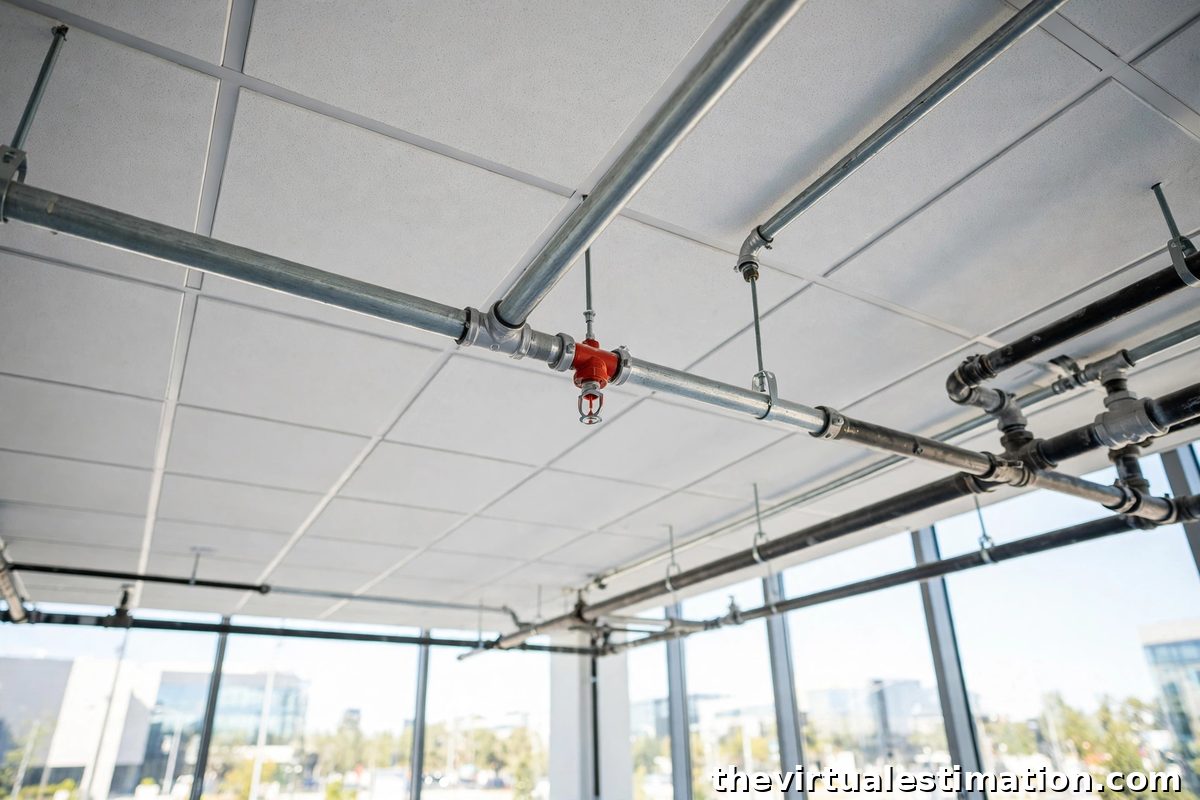
Two rows in that checklist deserve a closer look. The white-space floor is a real takeoff, not a line item you guess at, and the access flooring guide covers raised floor systems for data centers and office buildings in full, including the panel, pedestal and stringer counts this post does not repeat. Hall protection is the same story: the fire suppression guide covers sprinkler heads, pipe and hangers, and the fire alarm guide covers devices, panels, wiring and detector counts, so use those two posts for the hall protection quantities.
Scope lines estimators most often miss
Five scope lines sink data center estimates more than any pricing error. First, utility-side work and who pays for it: substation, switchyard, transmission extension, protection relays and transformer bays, and a large-campus interconnection can run $25 million to $60 million in secondary reporting, with regulators shifting more of that cost to the large customer. Second, water for cooling and whether the site can actually supply it. Third, phased energization, because halls are delivered in phases and each phase carries its own power and cooling scope. Fourth, commissioning as a priced scope with levels 1 through 5 and an integrated systems test, not a handover note. Fifth, contingency sized to the equipment lead times, not to the shell, because a six-month switchgear delay costs more than a shell overrun. Where a tilt-up shell is the chosen structure, the tilt-up estimating guide covers that takeoff.
Texas: schedule risk in 2027, not a cost change
Texas matters to this audience, and Texas data center approvals changed in the fall of 2026. Present this as schedule and approval risk, not as a change to cost per megawatt, and do not apply it outside Texas. On August 3, 2026, ERCOT paused Batch Zero study, final classification and energization approvals for computational loads of 75 megawatts or more, with verification reports due December 10, 2026, and ERCOT has said the Batch Zero study will not finish by April 9, 2027. Provisional classifications were issued September 3, 2026, verification requests went out September 9, 2026, and ERCOT's November 4 filing in PUCT Project No. 59142 says second-round verification requests are going to an expected 80% of developers, with fewer questions and a five-business-day deadline, so ERCOT can file by December 10. Existing operating data centers keep running. On September 18, 2026, the PUCT adopted 16 TAC Section 25.194, effective October 8, 2026, covering new interconnections of 75 megawatts or more, expansions crossing 75 megawatts, and additions of 75 megawatts or more. Before study inclusion, a project pays a $100,000 study fee plus refundable financial security of $50,000 per megawatt of requested peak demand. That $50,000 per megawatt is refundable security, never a fee and never a cost per megawatt; the proposed non-refundable fee of the same amount was dropped, and the Standard Large Load Interconnection Agreement form was deferred to a separate rulemaking (Project 59999). On September 21, 2026, the governor directed TCEQ to pause issuance of all permits related to data center projects until ERCOT completes its review, with no megawatt floor and no carve-out for off-grid projects. TCEQ told the governor on October 19, 2026 that it had paused issuance, and on October 19 and 20 it suspended at least 17 permits it had issued to data center developers. A FracTracker and Public Citizen report on October 20 identified 35 TCEQ permitting actions after September 21; the governor's office said no permits had been approved and TCEQ said affected applications are screened and paused. Present the pause as contested in its implementation, not as a clean halt, and do not present those 35 actions as approvals.
The politics around the pause move the schedule, not the benchmark. Gina Hinojosa won the Texas governor race on November 3, 2026, campaigning on an immediate moratorium on new data center approvals until the Legislature passes protections, and she said on October 22, 2026 that she would issue a moratorium as governor. That is a campaign promise, not a law and not a signed order: no moratorium text has been published, and she takes office January 19, 2027, so she cannot impose one before then. The Abbott audit pause still governs today. December 10 is the first decision point, when ERCOT files and Abbott decides whether to extend the pause, lift it or let it lapse, not the date the pause automatically lifts. Aurora Energy Research, via the Houston Chronicle on November 6, says the pause could run into June or July 2027, because a law passed in the spring session would not take effect until September 2027; that is one analyst's view, attributed, never a scheduled date. Bill filing for the 90th Texas Legislature opened Monday, November 9, 2026, and by 5 p.m. that day more than 1,260 bills had been filed. Proposals were filed to require large data centers to share water-usage information with the Texas Water Development Board (a bill by Senator Judith Zaffirini, Democrat of Laredo), and to bar data centers from pursuing local tax incentives and prevent cities and counties from renewing those already in place (also Zaffirini, covering Chapter 380, 381 and 312 agreements). Lawmakers from both parties also filed bills to repeal the state sales and use tax exemption for data centers, which the Texas Tribune reported in April had ballooned to more than $1 billion a year in revenue foregone. Grid proposals were also floated, one to require data centers to join the back of the queue for interconnection, another to limit use of backup generation in grid emergencies. No bill number is named here because none was verified against a primary source. Nothing has passed. The session convenes January 12, 2027, filing ends March 12, 2027, and the session ends May 31, 2027. For scale, Texas holds about 27% of planned US data center capacity (Wells Fargo), ERCOT was tracking 474.7 gigawatts of large-load requests in June 2026, about 420.8 gigawatts of it data centers, and about 13.3 gigawatts of announced projects are put at risk (Jefferies and GLJ Research). Do not present the 474 gigawatt queue as projects that would all be built.
For an estimator, the Texas takeaway is simple: price the job the same way you would anywhere else, but carry the approval timeline as a schedule risk with a named owner, and never promise an energization date that depends on a Batch Zero decision you do not control.
How to use these numbers in a 2027 bid
Start with the load. Confirm the critical IT megawatts, the rack count and kilowatts per rack, and the tier in writing before you price anything. Pick the benchmark row that matches your scope and your facility type, then adjust for your market using the Turner & Townsend spread, Dallas at the low end and Silicon Valley at the high end, rather than a national average. Price the power chain and the cooling chain system by system, with a quantity, a unit and a lead time for each. Add the scope lines above as priced items, not as allowances, and size the contingency to the equipment lead times. Run the per-square-foot check last, and if it disagrees with the per-megawatt number by a wide margin, find out which scope is wrong before you submit. For a full construction estimating service on a data center bid, that sequence is the difference between a number you can defend in a bid review and a number you have to explain later.
Frequently asked questions
How much does it cost to build a data center per megawatt in 2027?
Using the latest published benchmarks, all from 2026 sources: shell and core averages about $11.3 million per megawatt globally (JLL), construction only averages about $12.1 million per megawatt in the US (Turner & Townsend), and an all-in greenfield build averages about $17.6 million per megawatt (Cushman & Wakefield). AI fit-outs can reach $25 million per megawatt, and a fully equipped AI campus with GPUs runs about $35 million to $60 million per megawatt. No 2027 edition of these indexes had been published at the time of writing.
Why do two data center cost-per-megawatt figures disagree?
Because they price different scopes. Shell and core, construction only, all-in greenfield and all-in with GPUs are four different measures, and the market, the tier and the cooling system move the number further. Two figures can both be right for the same market when their scope lines differ, so always ask what a figure covers before you compare it with another one.
What is the biggest cost driver in a data center estimate?
Power infrastructure, which Cushman & Wakefield puts at about 21% of a greenfield build, followed by cooling at 20 to 30% of a buildout budget in a narrower scope. After megawatts, the tier is the largest single lever: Tier IV costs about 25 to 50% more than Tier III, and Tier II runs roughly 20 to 30% cheaper than Tier III.
Data centers reward estimators who start from the load and price every system in the power and cooling chains, and they punish anyone who prices by the square foot. If you are bidding one in 2027, build the estimate the way the building gets built, carry the scope line with every number, and keep the Texas approval timeline as a schedule risk with a named owner. The Virtual Estimation provides construction estimating services for data center, MEP and electrical work across the US, and you can reach the team at info@thevirtualestimation.com to talk through a bid before you submit it.